Creating a PowerBI report with DirectQuery and multiple SQL Database sources using Elastic Query

This post explains how to create a PowerBI report which sources data from two separate Azure SQL Databases.
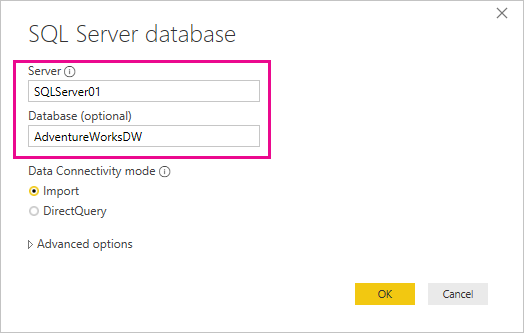
PowerBI offers two data access mechanisms; Import and DirectQuery.
DirectQuery provides a range of benefits, the chief of which is that data is automatically refreshed. DirectQuery doesn’t import any data into PowerBI, instead it queries the data sources as you interact with visualisations, making it the best option for larger datasets.
However, it is only possible to connect to one SQL Database as a data source when you use DirectQuery. If you try to add a second database as a data source, you’ll be notified that it would be necessary to switch to Import mode to continue. This is the case even if both databases are on the same server.
Error message
Azure SQL Database Elastic Query provides a way round this problem. It allows you to run T-SQL queries across multiple databases, though adding an external table to one of the databases, which draws its data from a table in the other database. By setting up an external table in a database, you can create a PowerBI report which uses DirectQuery, but can indirectly access data from another database through it.
Following the Azure Elastic Query docs, imagine that we want to create a PowerBI report, using DirectQuery, which primarily draws from an Orders database, but which also uses data from a Customers database. Without Elastic Query, you can only get data from the Orders database.
REport with orders database only
We’ll set up an external table so that Customer information can be added to the report as well, without having to switch to Import mode.
If you want to follow along end to end, the first step is to create two Azure SQL Server Databases through the Azure portal. They can either be on the same or different servers.
Add a firewall rule to the server, so you can access it from your machine. Then using a tool such as SQL Management Studio, add an OrderInformation table to the Orders database, and a CustomerInformation table to the Customers database (there are scripts for this in the Azure Elastic Query docs).
Databases with data in SQL MS
Once the databases and tables are set up, the steps to set up an external table in the Orders database are as follows:
1. Create a master key and scoped credential in the Orders database, using the credentials for the Customers database.
CREATE MASTER KEY ENCRYPTION BY PASSWORD = '';
CREATE DATABASE SCOPED CREDENTIAL ElasticDBQueryCred
WITH IDENTITY = '',
SECRET = '';
2. Create an external data source using the credential created above
CREATE EXTERNAL DATA SOURCE MyElasticDBQueryDataSrc WITH
(TYPE = RDBMS,
LOCATION = <server location>,
DATABASE_NAME = 'Customers',
CREDENTIAL = ElasticDBQueryCred,
);
Location should be the full server location e.g. ‘MyServer.database.windows.net’.
3. Create an external table in the Orders database, which has the same schema as the CustomerInformation table in the Customers database.
CREATE EXTERNAL TABLE [dbo].[CustomerInformation]
( [CustomerID] [int] NOT NULL,
[CustomerName] [varchar](50) NOT NULL,
[Company] [varchar](50) NOT NULL)
WITH
( DATA_SOURCE = MyElasticDBQueryDataSrc)
If a table with the same name existed already in the Orders database, you’d have to give it a different name..
These steps let you access the data in the CustomerInformation table in the Customers database as if it were a table in the Orders database.
Data from external table
Obviously you can go on and add other external tables if you want more data from the other database.
Please note that to view the external table in SQL Server Management Studio, you will need version 2016 or above.
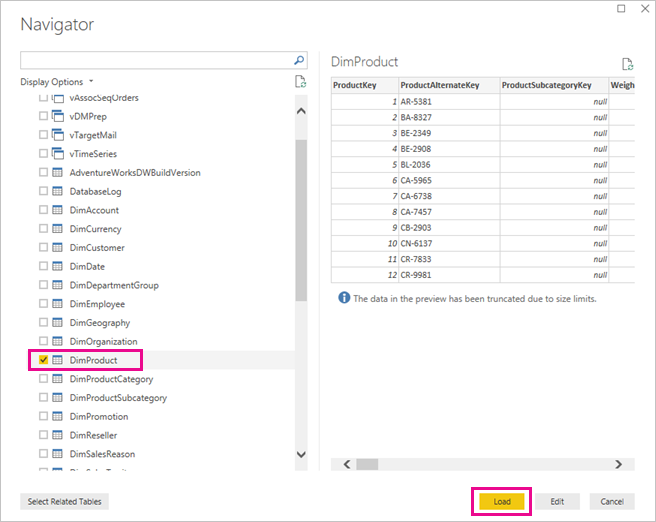
The external CustomerInformation table will now be available in your PowerBI report.
To add it, edit the report and add a new query – select the same server, and choose the external table, which will be displayed in the same way as a normal table.
Selecting both tables
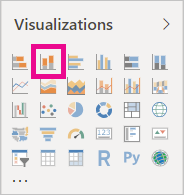
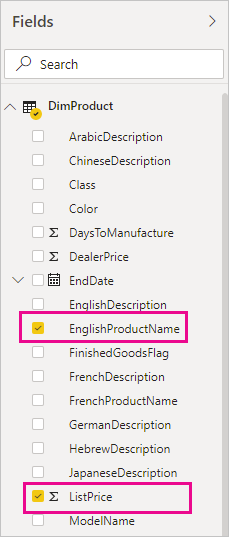
You can then create a relationship between the two tables in PowerBI.
Setting up a relationship
This gives you the option to show customer names rather than IDs in visualisations, and produce a nicer report.
Report with both tables
P.s. if you followed along from the start, remember to delete the new SQL Databases and Server you created!
This is just scratching the surface of Elastic Query, which can also be used to push SQL parameters to remote databases, execute remote stored procedures or call remote functions, and refer to remote tables with a different schema.

Resources

Microsoft PowerBI - Moving report from On Prem to Cloud - Setting up the connections

Refresh data from an on-premises SQL Server database

In this tutorial, you explore how to refresh a Power BI dataset from a relational database that exists on premises in your local network. Specifically, this tutorial uses a sample SQL Server database, which Power BI must access through an on-premises data gateway.
In this tutorial, you complete the following steps:
  • Create and publish a Power BI Desktop (.pbix) file that imports data from an on-premises SQL Server database.
  • Configure data source and dataset settings in Power BI for SQL Server connectivity through a data gateway.
  • Configure a refresh schedule to ensure your Power BI dataset has recent data.
  • Perform an on-demand refresh of your dataset.
  • Review the refresh history to analyze the outcomes of past refresh cycles.
  • Clean up resources by deleting the artifacts created in this tutorial.

Prerequisites

 Note
If you're not a gateway administrator and don't want to install a gateway yourself, contact a gateway administrator in your organization. They can create the required data source definition to connect your dataset to your SQL Server database.

Create and publish a Power BI Desktop file

Use the following procedure to create a basic Power BI report using the AdventureWorksDW sample database. Publish the report to the Power BI service, so that you get a dataset in Power BI, which you can then configure and refresh in subsequent steps.
  1. In Power BI Desktop, on the Home tab, select Get Data > SQL Server.
  2. In the SQL Server database dialog box, enter the Server and Database (optional) names, make sure the Data Connectivity mode is Import, and then select OK.
    SQL Server database
  3. Verify your credentials, then select Connect.
     Note
    If you're unable to authenticate, make sure you select the correct authentication method and use an account with database access. In test environments, you might use Database authentication with an explicit username and password. In production environments, you typically use Windows authentication. Refer to Troubleshooting refresh scenarios and contact your database administrator for additional assistance.
  4. If an Encryption Support dialog box appears, select OK.
  5. In the Navigator dialog box, select the DimProduct table, then select Load.
    Data source navigator
  6. In the Power BI Desktop Report view, in the Visualizations pane, select the Stacked column chart.
    Stacked column chart
  7. With the column chart selected in the report canvas, in the Fields pane select the EnglishProductName and ListPrice fields.
    Fields pane
  8. Drag the EndDate onto Report level filters, and under Basic filtering select only the checkbox for (Blank).
    Report level filters
    The chart should now look like the following.
    Finished column chart
    Notice that the five Road-250 products are listed with the highest list price. This will change when you update the data and refresh the report later in this tutorial.
  9. Save the report with the name "AdventureWorksProducts.pbix".
  10. On the Home tab select Publish > My Workspace > Select. Sign in to the Power BI service if you're asked to do so.
  11. On the Success screen, select Open 'AdventureWorksProducts.pbix' in Power BI.

Connect a dataset to a SQL Server database

In Power BI Desktop, you connected directly to your on-premises SQL Server database, but the Power BI service requires a data gateway to act as a bridge between the cloud and your on-premises network. Follow these steps to add your on-premises SQL Server database as a data source to a gateway and then connect your dataset to this data source.
  1. Sign in to Power BI. In the upper-right corner, select the settings gear icon and then select Settings.
    Power BI settings
  2. On the Datasets tab, select the dataset AdventureWorksProducts, so you can connect to your on-premises SQL Server database through a data gateway.
  3. Expand Gateway connection and verify that at least one gateway is listed. If you don't have a gateway, see the Prerequisites section earlier in this tutorial for a link to the product documentation for installing and configuring a gateway.
    Gateway connection
  4. Under Actions, expand the toggle button to view the data sources and select the Add to gateway link.
    Add data source to gateway
     Note
    If you're not a gateway administrator and don't want to install a gateway yourself, contact a gateway administrator in your organization. They can create the required data source definition to connect your dataset to your SQL Server database.
  5. On the Gateways management page, on the Data Source Settings tab, enter and verify the following information, and select Add.
    OptionValue
    Data Source NameAdventureWorksProducts
    Data Source TypeSQL Server
    ServerThe name of your SQL Server instance, such as SQLServer01 (must be identical to what you specified in Power BI Desktop).
    DatabaseThe name of your SQL Server database, such as AdventureWorksDW (must be identical to what you specified in Power BI Desktop).
    Authentication MethodWindows or Basic (typically Windows).
    UsernameThe user account you use to connect to SQL Server.
    PasswordThe password for the account you use to connect to SQL Server.
    Data source settings
  6. On the Datasets tab, expand the Gateway connection section again. Select the data gateway you configured, which shows a Status of running on the machine where you installed it, and select Apply.
    Update gateway connection

Configure a refresh schedule

Now you've connected your dataset in Power BI to your SQL Server database on-premises through a data gateway, follow these steps to configure a refresh schedule. Refreshing your dataset on a scheduled basis helps to ensure that your reports and dashboards have the most recent data.
  1. In the left navigation pane, open My Workspace > Datasets. Select the ellipsis (. . .) for the AdventureWorksProducts dataset, then select Schedule refresh.
     Note
    Make sure you select the ellipsis for the AdventureWorksProducts dataset and not the ellipsis for the report with the same name. The context menu of the AdventureWorksProducts report does not include a Schedule refresh option.
  2. In the Scheduled refresh section, under Keep your data up to date, set refresh to On.
  3. Select an appropriate Refresh frequency, ( Daily for this example), and then under Time, select Add another time to specify the desired refresh time (6:30 AM and PM for this example).
    Configure scheduled refresh
     Note
    You can configure up to 8 daily time slots if your dataset is on shared capacity, or 48 time slots on Power BI Premium.
  4. Leave the checkbox Send refresh failure notification emails to me enabled and select Apply.

Perform an on-demand refresh

Now that you've configured a refresh schedule, Power BI refreshes your dataset at the next scheduled time, within a margin of 15 minutes. If you want to refresh the data sooner, such as to test your gateway and data source configuration, perform an on-demand refresh by using the Refresh Now option in the dataset menu in the left navigation pane. On-demand refreshes don't affect the next scheduled refresh time, but they count against the daily refresh limit, mentioned in the previous section.
For illustration purposes, simulate a change to the sample data by updating the DimProduct table in the AdventureWorksDW database using SQL Server Management Studio (SSMS).
SQL

UPDATE [AdventureWorksDW].[dbo].[DimProduct]
SET ListPrice = 5000
WHERE EnglishProductName ='Road-250 Red, 58'

Now follow these steps so the updated data can flow through the gateway connection to the dataset and into the reports in Power BI.
  1. In the Power BI Service, in the left navigation pane, select and expand My Workspace.
  2. Under Datasets, for the AdventureWorksProducts dataset, select the ellipsis (. . .) then select Refresh now.
    Refresh now
    Note in the upper right corner, that Power BI is preparing to perform the requested refresh.
  3. Select My Workspace > Reports > AdventureWorksProducts. See how the updated data flowed through, and the product with the highest list price is now Road-250 Red, 58.
    Updated column chart

Review the refresh history

It is a good idea to check the outcomes of past refresh cycles periodically in the refresh history. Database credentials might have expired, or the selected gateway might have been offline when a scheduled refresh was due. Follow these steps to examine the refresh history and check for issues.
  1. In the upper-right corner of the Power BI user interface, select the settings gear icon and then select Settings.
  2. Switch to Datasets and select the dataset, such as AdventureWorksProducts, you want to examine.
  3. Select the Refresh history link to open the Refresh history dialog.
    Refresh history link
  4. On the Scheduled tab, notice the past scheduled and on-demand refreshes with their Start and End times, and a Status of Completed, which indicates that Power BI performed the refreshes successfully. For failed refreshes, you can see the error message and examine error details.
    Refresh history details
     Note
    The OneDrive tab is only relevant for datasets connected to Power BI Desktop files, Excel workbooks, or CSV files on OneDrive or SharePoint Online, as explained in more detail in Data refresh in Power BI.

Clean up resources

If you don't want to use the sample data anymore, drop the database in SQL Server Management Studio (SSMS). If you don't want to use the SQL Server data source, remove the data source from your data gateway. Also consider uninstalling the data gateway if you only installed it for the purposes of completing this tutorial. You should also delete the AdventureWorksProducts dataset and AdventureWorksProducts report that Power BI created when you uploaded the AdventureWorksProducts.pbix file.

Next steps

In this tutorial, you've explored how to import data from an on-premises SQL Server database into a Power BI dataset and how to refresh this dataset on a scheduled and on-demand basis to keep the reports and dashboards that use this dataset updated in Power BI. Now you can learn more about managing data gateways and data sources in Power BI. It might also be a good idea to review the conceptual article Data Refresh in Power BI.