Showing posts with label Microsoft Power BI. Show all posts

Microsoft Power BI Data Governance Strategy

Managing permissions and data governance in Microsoft Power BI cloud (Power BI Service) across multiple divisions and business areas (like Finance, Technical BI, Customer BI) requires a structured, scalable, and secure model that aligns with both organizational structure and data security policies.


Below is a step-by-step best practice approach, starting with the Finance department, and expanding to other departments.


πŸ” Step 1: Establish Governance Framework


a. Define Roles and Responsibilities


  • Data Owners (e.g., Treasury lead): approve access to datasets and reports.
  • Data Stewards: maintain data quality, define business terms.
  • Power BI Admins: manage workspace structure, monitor usage, enforce policies.
  • Report Authors: develop dashboards and reports.
  • Consumers/Business Users: view and interact with reports.


πŸ—️ Step 2: Design Workspace Strategy


Finance Department (Separate Workspaces per Business Area):


Create dedicated Power BI Workspaces for each business area:


  • Finance – Treasury
  • Finance – GBS
  • Finance – Business Finance
  • Finance – CIT
  • Finance – FBI


Each workspace is:


  • Owned by the department/data owners
  • Has clear permissions (see below)
  • Used for publishing datasets, reports, dashboards


Other Departments:


  • Technical BI
  • Customer BI
  • Other shared or cross-departmental workspaces as needed


πŸ‘₯ Step 3: Set Up Role-Based Access Control (RBAC)


Use Power BI roles + Azure Active Directory (AAD) Security Groups:


  • Create AAD groups for each access level (viewers, contributors, admins).
  • Map groups to workspace roles:

  • Admin – for workspace owners
  • Member – for key contributors
  • Contributor – for report developers
  • Viewer – for report consumers


Example (Finance – Treasury):


  • Finance-Treasury-Admins
  • Finance-Treasury-Contributors
  • Finance-Treasury-Viewers


Benefits:


  • Centralized permission management
  • Easy onboarding/offboarding of users


πŸ“Š Step 4: Centralize and Govern Data Sources


Use 

Shared Datasets

:


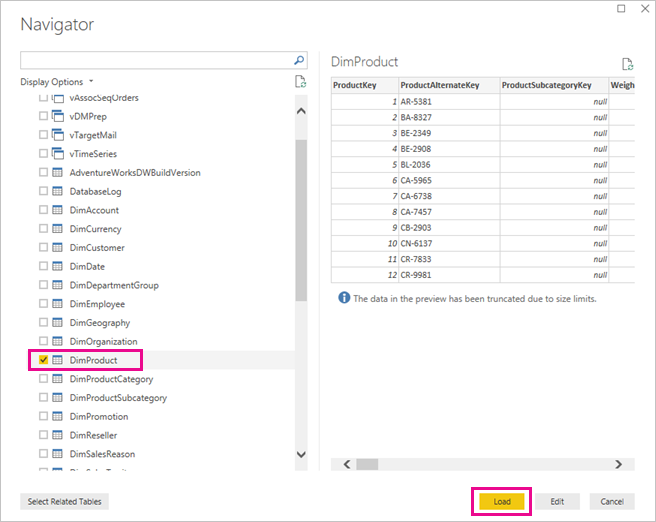
  • Create certified or promoted datasets in centralized workspaces (e.g., Finance – Data Models)
  • Enable reusability across business areas and reports


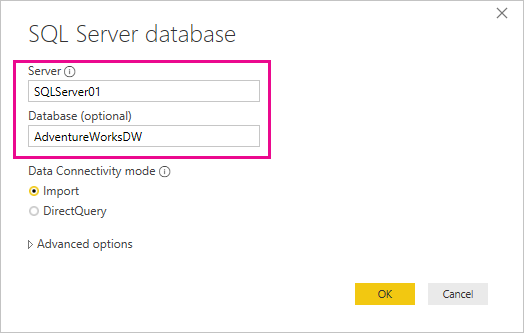
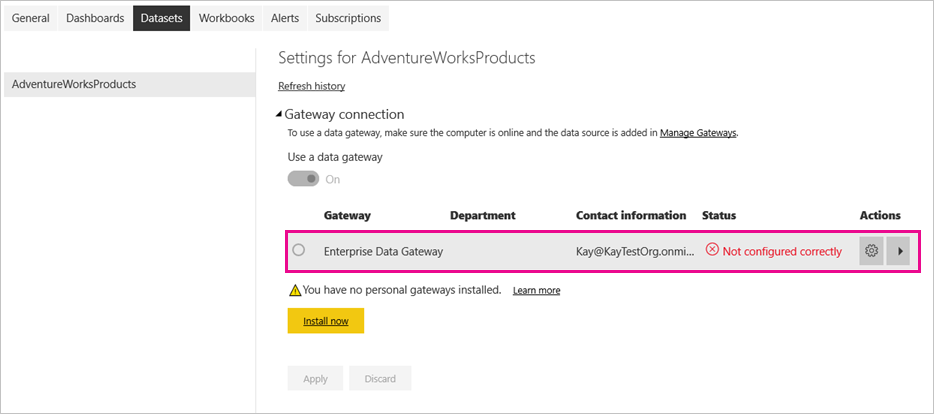
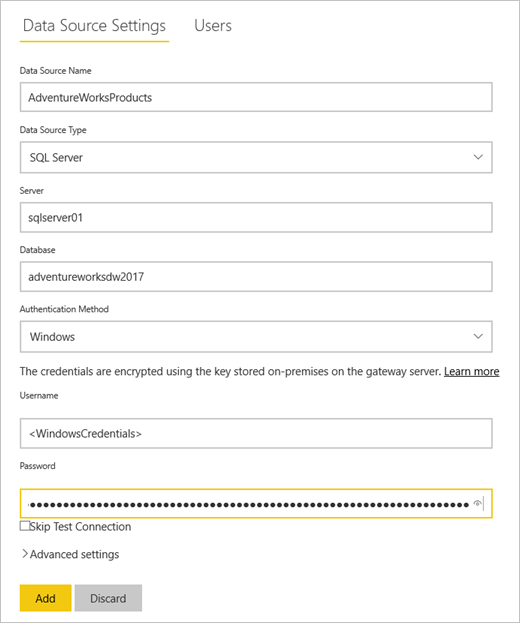
Configure Data Source Credentials:


  • Use Gateway Connections for on-premises sources
  • Use Managed Identity or Service Principal where possible


Define Access at Source Level:


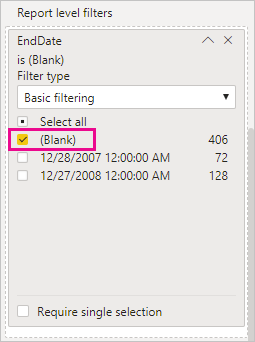
  • Use Row-Level Security (RLS) in the dataset to restrict data based on user identity
  • Example: RLS for business unit → only GBS users can see GBS financials


πŸ“± Step 5: Use Apps for Distribution


Package curated content into Power BI Apps for each audience:


  • Finance – Treasury App
  • Finance – CIT App
  • Customer BI – Insights App


Apps allow:


  • Clean, user-friendly interface
  • Controlled distribution
  • Audience-specific access without workspace access


πŸ›‘️ Step 6: Implement Data Governance Policies


a. Use Endorsement (Certified / Promoted Datasets)


  • Mark trusted datasets as certified or promoted
  • Restrict who can publish certified content


b. Lineage and Impact Analysis


  • Use Power BI Lineage View to track dependencies
  • Before updating a dataset, see which reports are impacted


c. Data Sensitivity Labels


  • Apply Microsoft Purview (formerly Information Protection) sensitivity labels
  • Enforce compliance and visibility across Microsoft 365


πŸ” Step 7: Monitor & Audit


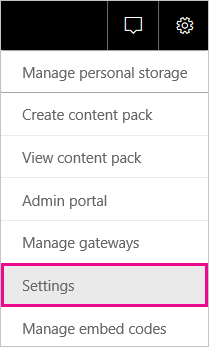
Use Power BI Admin Portal & Audit Logs:


  • Audit access, sharing, and usage
  • Set up usage metrics reports
  • Monitor for unauthorized sharing, or stale reports


Use Power BI Activity Logs (via Microsoft 365 compliance center) for detailed tracking.


πŸ” Step 8: Iterate, Scale, and Expand


  • Extend the above approach to Technical BI, Customer BI, and other departments
  • Create Data Domain Councils for cross-department governance
  • Run quarterly reviews of permissions, stale workspaces, and compliance


🚦Sample Finance Permission Table:

Workspace

AAD Admin Group

Contributor Group

Viewer Group

Finance Γ’€“ Treasury

Finance-Treasury-Admins

Finance-Treasury-Contributors

Finance-Treasury-Viewers

Finance Γ’€“ GBS

Finance-GBS-Admins

Finance-GBS-Contributors

Finance-GBS-Viewers

Finance Γ’€“ Data Models

Finance-Models-Admins

Finance-Models-DataStewards

Γ’€“ Certified Dataset Users Γ’€“


From Blogger iPhone client

Create import connection Microsoft power bi to big Query

you can create an Import query with a GCP BigQuery connection in Power BI, but there are important limitations and considerations depending on the Power BI version and data connector used.


✅ 

Import Mode with BigQuery – Supported


Power BI supports Import mode from Google BigQuery using the built-in connector, as long as:


  • You’re using Power BI Desktop
  • You have credentials (usually Google account OAuth2 or service account)
  • The dataset isn’t too large, since Import loads data into Power BI’s in-memory model


πŸ” 

Steps to Use Import Mode with BigQuery


  1. Open Power BI Desktop
  2. Go to Home > Get Data > More…
  3. Choose Google BigQuery (under Database category)
  4. Authenticate (with Google account or service account key)
  5. Navigate through your GCP project > Dataset > Tables
  6. In the navigator:

  7. Select tables or views
  8. At the bottom, choose Load (this is Import mode) or Transform Data to go through Power Query

  9. Power BI will load the data into memory and store it in the .pbix file


πŸ” Difference Between Import and DirectQuery


Feature

Import

DirectQuery

Performance

Fast for analysis (in-memory)

Slower Γ’€“ queries sent to BigQuery live

File Size

Limited by RAM (Power BI file grows)

Lightweight Γ’€“ no large data stored

Refresh

Needs scheduled refresh (via Gateway)

Live data, but limited transformations

Transformations

Full Power Query and DAX available

Limited Γ’€“ many transformations restricted


⚠️ Considerations and Limitations


  • Data size: BigQuery tables can be huge; import only what you need.
  • Cost: Importing large data can incur BigQuery query costs (pay-per-query).
  • Gateway requirement: Scheduled refresh in Power BI Service requires on-premises data gateway, even for cloud sources like BigQuery (unless using personal gateway or VNet).
  • Query Folding: Power Query may or may not fold your transformations back to BigQuery — if not, performance and cost may suffer.


πŸ’‘ Tip: Reduce Query Cost and Improve Performance


  • Use Custom SQL or BigQuery views to pre-aggregate/filter data before loading
  • Use incremental refresh (for large tables with date-based partitions)
  • Keep imports small or use DirectQuery/Hybrid mode when live data is essential


From Blogger iPhone client

Microsoft Power BI - Semantic Models

The semantic model in Power BI (also called the tabular model or data model) is designed primarily for data analysis and consumption, not for complex data transformation. Here’s why it has limitations on data transformation:


πŸ”Ή 1. 

Performance and Optimization Focus


  • Semantic models are optimized for fast querying, aggregations, and visualizations.
  • Allowing heavy transformations at query time would slow down performance, defeating the purpose of a semantic model.


πŸ”Ή 2. 

Design Separation: Transform vs Model


Power BI follows a separation of concerns:


  • Power Query (M) handles data transformation and shaping (ETL).
  • Semantic model (DAX) handles calculated columns, measures, relationships, and business logic.


This ensures:


  • Cleaner models
  • Reusability
  • Efficient refresh and query performance


πŸ”Ή 3. 

DAX Is Not Meant for ETL


  • DAX (used in the semantic model) is designed for calculated logic on already loaded data, not for:
  • Complex joins
  • Row-level transformations
  • Column reshaping or unpivoting

  • These tasks are meant to be done in Power Query or upstream ETL tools (like Alteryx, SQL, etc.).


πŸ”Ή 4. 

Storage Engine Constraints


  • The semantic model uses VertiPaq, an in-memory columnar storage engine.
  • VertiPaq is efficient only if data is clean and structured. Transformations can:
  • Increase model size
  • Reduce compression efficiency
  • Slow down queries


πŸ”Ή 5. 

Governance and Maintainability


  • If complex transformations are done within the semantic model:
  • It becomes harder to audit, manage, or debug.
  • Data lineage becomes less transparent.
  • Data governance is weakened.


✅ What the Semantic Model 

Should Do


  • Define relationships
  • Add business logic (measures, KPIs, hierarchies)
  • Handle role-level security
  • Enable efficient slicing and dicing of clean, transformed data


🧠 Best Practice


Perform all heavy transformations in Power Query or a data warehouse. Use the semantic model only for modeling and business logic.


From Blogger iPhone client

Tableau to Power BI migration

Migrating from Tableau to Power BI is a bit complex due to the differences in their underlying architectures, APIs, and file formats. While there’s no official one-click migration tool from Tableau to Power BI, you can automate parts of the process using Python, REST APIs, and third-party tools.


Here’s a breakdown of what you can do and how to approach building a migration script using Python:


Step 1: Extract Metadata from Tableau


Use the Tableau REST API and Metadata API (GraphQL) to extract workbooks, datasources, and visualization metadata.


Python Example (Tableau Metadata API):


Use Python libraries like gql or requests to send this GraphQL query.


Step 2: Parse and Convert the Metadata


Translate the Tableau metadata into something Power BI understands. This requires custom mapping logic:


  • Tableau Viz → Power BI Visual
  • Tableau Filters → Power BI Slicers
  • Tableau Data Sources → Power BI Dataflows or imported datasets


You can write this logic using pandas or custom JSON translators.


Step 3: Use Power BI REST API to Create Equivalent Artifacts


Power BI’s REST API supports operations like:


  • Creating workspaces
  • Uploading PBIX files
  • Updating datasets
  • Managing reports


However, you cannot programmatically create detailed visuals via REST API alone — that requires Power BI Desktop and the PBIX format.


But you can prepare data and models using:


  • Power BI XMLA endpoint
  • Tabular Editor (for datasets)
  • Power BI Desktop Automation using PowerShell/Python & PBIX Templates


Alternative/Third-party Tooling


Some tools that can help in this migration:


  • Power BI XMLA/Tabular Editor: To create models programmatically.
  • Tableau to Power BI Migration Tool by MAQ Software (limited features).
  • ZappySys ODBC Drivers / ETL tools to extract Tableau data and push to Power BI.
  • Alteryx or KNIME: As middle-layer ETL tools.


Caution


  • Visuals cannot be directly migrated — you’ll need to recreate them.
  • Some calculations (e.g., LOD in Tableau) must be translated manually into DAX.
  • Tableau dashboards (layouts, interactivity) won’t be 1:1 with Power BI.


Want a Starter Script?


If you’re interested, I can generate a Python starter script that:


  • Authenticates with Tableau
  • Extracts workbook metadata
  • Prepares a mapping JSON for Power BI


Let me know how automated you want it (full flow vs metadata only).


From Blogger iPhone client


MAQ Software offers a Tableau to Power BI migration tool called MigrateFAST, which aims to simplify and accelerate the process of transitioning from Tableau to Power BI. This tool, powered by AI, is designed to help businesses migrate large volumes of reports, potentially saving time and resources. 


Key Features and Benefits: 

  • AI-Powered Migration:
  • MigrateFAST utilizes artificial intelligence to automate and expedite the migration process. 
  • Large-Scale Migration:
  • The tool is designed to handle large-scale migrations of reports from Tableau to Power BI. 
  • Time and Cost Savings:
  • By automating the migration, MigrateFAST can reduce the time and resources required, potentially leading to cost savings. 
  • Optimized Conversion:
  • The tool focuses on ensuring high-quality and accurate report conversion during the migration process. 
  • Data Discovery and Exploration:
  • MigrateFAST can help streamline the data discovery and exploration process, allowing for more intuitive and accessible data insights. 
  • 6-Week Implementation:
  • MAQ Software claims to offer a 6-week implementation plan for the migration process. 
  • Expert Support:
  • MAQ Software provides expert support and guidance throughout the migration process. 
  • Other Services:
  • MAQ Software also offers services like performance analysis, report optimization, and adoption training to support the overall migration and adoption of Power BI. 

How MigrateFAST Works: 

MigrateFAST, according to MAQ Software, uses AI to analyze and convert Tableau workbooks (.twbx) to Power BI, simplifying the migration process. It can automate tasks, reduce manual effort, and improve the accuracy of the conversion, ultimately leading to a smoother transition to Power BI. 


For a more detailed understanding of MAQ Software's services and the MigrateFAST tool, it is recommended to visit their website


Market Share Tableau vs Microsoft Power BI vs Qlik - 2024

 As of 2024, Power BI, Tableau, and Qlik remain the dominant players in the business intelligence (BI) and data visualization market, each excelling in different areas.

Market Share and Popularity:

  • Power BI by Microsoft continues to lead the market, largely due to its integration with the Microsoft ecosystem and its cost-effectiveness, especially with pricing as low as $10 per user per month for its Pro version. Power BI has a strong community, thanks to Microsoft’s vast developer network and support​()().
  • Tableau, acquired by Salesforce, is a significant player, particularly known for its advanced visualizations and geospatial capabilities. However, it tends to be more expensive, with costs around $70 per user per month. Tableau is favored in environments requiring sophisticated visual storytelling​()().
  • Qlik Sense offers strong data preparation and direct query capabilities, making it competitive in advanced analytics and enterprise-level deployments. While not as dominant in market share as Power BI or Tableau, Qlik stands out for flexibility, particularly in cloud and hybrid environments​()().

Strengths:

  • Power BI: Cost-effective, seamless integration with Microsoft products, strong AI/ML features, and excellent for small to medium-sized enterprises.
  • Tableau: Best-in-class for geospatial visualizations and detailed storytelling through data.
  • Qlik: Strong in enterprise applications, data preparation, and hybrid cloud environments.

In summary, Power BI leads in market share, followed closely by Tableau, with Qlik making inroads in specific enterprise scenarios.

Microsoft Power BI

Microsoft Power BI is a business intelligence (BI) suite that helps you analyze data and share insights. It provides a variety of tools for data visualization, reporting, and dashboarding. Power BI can be used to connect to a variety of data sources, including cloud-based data warehouses, on-premises databases, and spreadsheets.

Power BI is a popular BI tool among businesses of all sizes. It is used by businesses to make better decisions, improve operations, and communicate insights to stakeholders.

Here are some of the features of Power BI:

  • Data connectivity: Power BI can connect to a variety of data sources, including cloud-based data warehouses, on-premises databases, and spreadsheets.
  • Data visualization: Power BI provides a variety of tools for data visualization, including charts, graphs, and maps. These visualizations can be used to explore data, identify trends, and communicate insights.
  • Reporting: Power BI can be used to create reports that summarize data and present it in a clear and concise way. Reports can be shared with stakeholders to keep them informed of the latest data.
  • Dashboards: Power BI can be used to create dashboards that display key metrics and insights. Dashboards can be customized to meet the specific needs of the user.
  • Collaboration: Power BI allows users to collaborate on data visualizations and reports. This can be done by sharing dashboards or by working on the same visualization together.
  • Extensibility: Power BI is extensible with a variety of add-ons and connectors. This allows users to customize Power BI to meet their specific needs.

Power BI is a powerful BI tool that can be used to make better decisions, improve operations, and communicate insights to stakeholders. If you are looking for a BI tool, Power BI is a good option to consider.

Here are some of the benefits of using Power BI:

  • Ease of use: Power BI is a user-friendly BI tool that can be used by people with no prior experience in data visualization.
  • Powerful features: Power BI offers a wide range of features for data visualization, reporting, and dashboarding.
  • Scalability: Power BI can be used to handle large datasets and complex visualizations.
  • Cost-effectiveness: Power BI is a cost-effective BI tool that is available in a variety of pricing plans.

If you are considering using Power BI, I recommend that you do the following:

  • Try the free trial: Power BI offers a free trial that you can use to test the software.
  • Read the documentation: Power BI provides comprehensive documentation that you can use to learn how to use the software.
  • Take a training course: Power BI offers a variety of training courses that you can take to learn how to use the software.
  • Join the community: Power BI has a large and active community of users who can help you with questions and problems.

Microsoft Power BI vs Tableau

Tableau and Microsoft Power BI are both business intelligence (BI) tools that allow you to visualize and analyze data. They are both powerful tools, but they have different strengths and weaknesses.

Tableau is known for its ease of use and its ability to create interactive dashboards and visualizations. It is a good choice for organizations that need to make data-driven decisions quickly and easily. Tableau is also a good choice for organizations that need to share data with non-technical users.

Microsoft Power BI is known for its scalability and its ability to connect to a variety of data sources. It is a good choice for organizations that have a lot of data and that need to be able to analyze it in different ways. Power BI is also a good choice for organizations that are using other Microsoft products, such as Excel and SQL Server.

Here is a table that summarizes the key differences between Tableau and Power BI:

FeatureTableauMicrosoft Power BI
Ease of useEasy to useMore complex to learn
Interactive dashboardsYesYes
Data visualizationPowerfulPowerful
ScalabilityLess scalableMore scalable
Data sourcesSupports a variety of data sourcesSupports a wider variety of data sources
Integration with other Microsoft productsNoYes
CostStarts at $70 per user per monthStarts at $9.99 per user per month

Ultimately, the best BI tool for you will depend on your specific needs and requirements. If you are looking for an easy-to-use tool that can be used to create interactive dashboards and visualizations, Tableau is a good choice. If you are looking for a scalable tool that can connect to a variety of data sources, Power BI is a good choice.

Creating a PowerBI report with DirectQuery and multiple SQL Database sources using Elastic Query

This post explains how to create a PowerBI report which sources data from two separate Azure SQL Databases.
PowerBI offers two data access mechanisms; Import and DirectQuery.
DirectQuery provides a range of benefits, the chief of which is that data is automatically refreshed. DirectQuery doesn’t import any data into PowerBI, instead it queries the data sources as you interact with visualisations, making it the best option for larger datasets.
However, it is only possible to connect to one SQL Database as a data source when you use DirectQuery. If you try to add a second database as a data source, you’ll be notified that it would be necessary to switch to Import mode to continue. This is the case even if both databases are on the same server.
Error message
Azure SQL Database Elastic Query provides a way round this problem. It allows you to run T-SQL queries across multiple databases, though adding an external table to one of the databases, which draws its data from a table in the other database. By setting up an external table in a database, you can create a PowerBI report which uses DirectQuery, but can indirectly access data from another database through it.
Following the Azure Elastic Query docs, imagine that we want to create a PowerBI report, using DirectQuery, which primarily draws from an Orders database, but which also uses data from a Customers database. Without Elastic Query, you can only get data from the Orders database.
REport with orders database only
We’ll set up an external table so that Customer information can be added to the report as well, without having to switch to Import mode.
If you want to follow along end to end, the first step is to create two Azure SQL Server Databases through the Azure portal. They can either be on the same or different servers.
Add a firewall rule to the server, so you can access it from your machine. Then using a tool such as SQL Management Studio, add an OrderInformation table to the Orders database, and a CustomerInformation table to the Customers database (there are scripts for this in the Azure Elastic Query docs).
Databases with data in SQL MS
Once the databases and tables are set up, the steps to set up an external table in the Orders database are as follows:
1. Create a master key and scoped credential in the Orders database, using the credentials for the Customers database.
CREATE MASTER KEY ENCRYPTION BY PASSWORD = '';
CREATE DATABASE SCOPED CREDENTIAL ElasticDBQueryCred
WITH IDENTITY = '',
SECRET = '';
2. Create an external data source using the credential created above
CREATE EXTERNAL DATA SOURCE MyElasticDBQueryDataSrc WITH
(TYPE = RDBMS,
LOCATION = <server location>,
DATABASE_NAME = 'Customers',
CREDENTIAL = ElasticDBQueryCred,
);
Location should be the full server location e.g. ‘MyServer.database.windows.net’.
3. Create an external table in the Orders database, which has the same schema as the CustomerInformation table in the Customers database.
CREATE EXTERNAL TABLE [dbo].[CustomerInformation]
( [CustomerID] [int] NOT NULL,
[CustomerName] [varchar](50) NOT NULL,
[Company] [varchar](50) NOT NULL)
WITH
( DATA_SOURCE = MyElasticDBQueryDataSrc)
If a table with the same name existed already in the Orders database, you’d have to give it a different name..
These steps let you access the data in the CustomerInformation table in the Customers database as if it were a table in the Orders database.
Data from external table
Obviously you can go on and add other external tables if you want more data from the other database.
Please note that to view the external table in SQL Server Management Studio, you will need version 2016 or above.
The external CustomerInformation table will now be available in your PowerBI report.
To add it, edit the report and add a new query – select the same server, and choose the external table, which will be displayed in the same way as a normal table.
Selecting both tables
You can then create a relationship between the two tables in PowerBI.
Setting up a relationship
This gives you the option to show customer names rather than IDs in visualisations, and produce a nicer report.
Report with both tables
P.s. if you followed along from the start, remember to delete the new SQL Databases and Server you created!
This is just scratching the surface of Elastic Query, which can also be used to push SQL parameters to remote databases, execute remote stored procedures or call remote functions, and refer to remote tables with a different schema.

Resources

Microsoft PowerBI - Moving report from On Prem to Cloud - Setting up the connections

Refresh data from an on-premises SQL Server database

In this tutorial, you explore how to refresh a Power BI dataset from a relational database that exists on premises in your local network. Specifically, this tutorial uses a sample SQL Server database, which Power BI must access through an on-premises data gateway.
In this tutorial, you complete the following steps:
  • Create and publish a Power BI Desktop (.pbix) file that imports data from an on-premises SQL Server database.
  • Configure data source and dataset settings in Power BI for SQL Server connectivity through a data gateway.
  • Configure a refresh schedule to ensure your Power BI dataset has recent data.
  • Perform an on-demand refresh of your dataset.
  • Review the refresh history to analyze the outcomes of past refresh cycles.
  • Clean up resources by deleting the artifacts created in this tutorial.

Prerequisites

 Note
If you're not a gateway administrator and don't want to install a gateway yourself, contact a gateway administrator in your organization. They can create the required data source definition to connect your dataset to your SQL Server database.

Create and publish a Power BI Desktop file

Use the following procedure to create a basic Power BI report using the AdventureWorksDW sample database. Publish the report to the Power BI service, so that you get a dataset in Power BI, which you can then configure and refresh in subsequent steps.
  1. In Power BI Desktop, on the Home tab, select Get Data > SQL Server.
  2. In the SQL Server database dialog box, enter the Server and Database (optional) names, make sure the Data Connectivity mode is Import, and then select OK.
    SQL Server database
  3. Verify your credentials, then select Connect.
     Note
    If you're unable to authenticate, make sure you select the correct authentication method and use an account with database access. In test environments, you might use Database authentication with an explicit username and password. In production environments, you typically use Windows authentication. Refer to Troubleshooting refresh scenarios and contact your database administrator for additional assistance.
  4. If an Encryption Support dialog box appears, select OK.
  5. In the Navigator dialog box, select the DimProduct table, then select Load.
    Data source navigator
  6. In the Power BI Desktop Report view, in the Visualizations pane, select the Stacked column chart.
    Stacked column chart
  7. With the column chart selected in the report canvas, in the Fields pane select the EnglishProductName and ListPrice fields.
    Fields pane
  8. Drag the EndDate onto Report level filters, and under Basic filtering select only the checkbox for (Blank).
    Report level filters
    The chart should now look like the following.
    Finished column chart
    Notice that the five Road-250 products are listed with the highest list price. This will change when you update the data and refresh the report later in this tutorial.
  9. Save the report with the name "AdventureWorksProducts.pbix".
  10. On the Home tab select Publish > My Workspace > Select. Sign in to the Power BI service if you're asked to do so.
  11. On the Success screen, select Open 'AdventureWorksProducts.pbix' in Power BI.

Connect a dataset to a SQL Server database

In Power BI Desktop, you connected directly to your on-premises SQL Server database, but the Power BI service requires a data gateway to act as a bridge between the cloud and your on-premises network. Follow these steps to add your on-premises SQL Server database as a data source to a gateway and then connect your dataset to this data source.
  1. Sign in to Power BI. In the upper-right corner, select the settings gear icon and then select Settings.
    Power BI settings
  2. On the Datasets tab, select the dataset AdventureWorksProducts, so you can connect to your on-premises SQL Server database through a data gateway.
  3. Expand Gateway connection and verify that at least one gateway is listed. If you don't have a gateway, see the Prerequisites section earlier in this tutorial for a link to the product documentation for installing and configuring a gateway.
    Gateway connection
  4. Under Actions, expand the toggle button to view the data sources and select the Add to gateway link.
    Add data source to gateway
     Note
    If you're not a gateway administrator and don't want to install a gateway yourself, contact a gateway administrator in your organization. They can create the required data source definition to connect your dataset to your SQL Server database.
  5. On the Gateways management page, on the Data Source Settings tab, enter and verify the following information, and select Add.
    OptionValue
    Data Source NameAdventureWorksProducts
    Data Source TypeSQL Server
    ServerThe name of your SQL Server instance, such as SQLServer01 (must be identical to what you specified in Power BI Desktop).
    DatabaseThe name of your SQL Server database, such as AdventureWorksDW (must be identical to what you specified in Power BI Desktop).
    Authentication MethodWindows or Basic (typically Windows).
    UsernameThe user account you use to connect to SQL Server.
    PasswordThe password for the account you use to connect to SQL Server.
    Data source settings
  6. On the Datasets tab, expand the Gateway connection section again. Select the data gateway you configured, which shows a Status of running on the machine where you installed it, and select Apply.
    Update gateway connection

Configure a refresh schedule

Now you've connected your dataset in Power BI to your SQL Server database on-premises through a data gateway, follow these steps to configure a refresh schedule. Refreshing your dataset on a scheduled basis helps to ensure that your reports and dashboards have the most recent data.
  1. In the left navigation pane, open My Workspace > Datasets. Select the ellipsis (. . .) for the AdventureWorksProducts dataset, then select Schedule refresh.
     Note
    Make sure you select the ellipsis for the AdventureWorksProducts dataset and not the ellipsis for the report with the same name. The context menu of the AdventureWorksProducts report does not include a Schedule refresh option.
  2. In the Scheduled refresh section, under Keep your data up to date, set refresh to On.
  3. Select an appropriate Refresh frequency, ( Daily for this example), and then under Time, select Add another time to specify the desired refresh time (6:30 AM and PM for this example).
    Configure scheduled refresh
     Note
    You can configure up to 8 daily time slots if your dataset is on shared capacity, or 48 time slots on Power BI Premium.
  4. Leave the checkbox Send refresh failure notification emails to me enabled and select Apply.

Perform an on-demand refresh

Now that you've configured a refresh schedule, Power BI refreshes your dataset at the next scheduled time, within a margin of 15 minutes. If you want to refresh the data sooner, such as to test your gateway and data source configuration, perform an on-demand refresh by using the Refresh Now option in the dataset menu in the left navigation pane. On-demand refreshes don't affect the next scheduled refresh time, but they count against the daily refresh limit, mentioned in the previous section.
For illustration purposes, simulate a change to the sample data by updating the DimProduct table in the AdventureWorksDW database using SQL Server Management Studio (SSMS).
SQL

UPDATE [AdventureWorksDW].[dbo].[DimProduct]
SET ListPrice = 5000
WHERE EnglishProductName ='Road-250 Red, 58'

Now follow these steps so the updated data can flow through the gateway connection to the dataset and into the reports in Power BI.
  1. In the Power BI Service, in the left navigation pane, select and expand My Workspace.
  2. Under Datasets, for the AdventureWorksProducts dataset, select the ellipsis (. . .) then select Refresh now.
    Refresh now
    Note in the upper right corner, that Power BI is preparing to perform the requested refresh.
  3. Select My Workspace > Reports > AdventureWorksProducts. See how the updated data flowed through, and the product with the highest list price is now Road-250 Red, 58.
    Updated column chart

Review the refresh history

It is a good idea to check the outcomes of past refresh cycles periodically in the refresh history. Database credentials might have expired, or the selected gateway might have been offline when a scheduled refresh was due. Follow these steps to examine the refresh history and check for issues.
  1. In the upper-right corner of the Power BI user interface, select the settings gear icon and then select Settings.
  2. Switch to Datasets and select the dataset, such as AdventureWorksProducts, you want to examine.
  3. Select the Refresh history link to open the Refresh history dialog.
    Refresh history link
  4. On the Scheduled tab, notice the past scheduled and on-demand refreshes with their Start and End times, and a Status of Completed, which indicates that Power BI performed the refreshes successfully. For failed refreshes, you can see the error message and examine error details.
    Refresh history details
     Note
    The OneDrive tab is only relevant for datasets connected to Power BI Desktop files, Excel workbooks, or CSV files on OneDrive or SharePoint Online, as explained in more detail in Data refresh in Power BI.

Clean up resources

If you don't want to use the sample data anymore, drop the database in SQL Server Management Studio (SSMS). If you don't want to use the SQL Server data source, remove the data source from your data gateway. Also consider uninstalling the data gateway if you only installed it for the purposes of completing this tutorial. You should also delete the AdventureWorksProducts dataset and AdventureWorksProducts report that Power BI created when you uploaded the AdventureWorksProducts.pbix file.

Next steps

In this tutorial, you've explored how to import data from an on-premises SQL Server database into a Power BI dataset and how to refresh this dataset on a scheduled and on-demand basis to keep the reports and dashboards that use this dataset updated in Power BI. Now you can learn more about managing data gateways and data sources in Power BI. It might also be a good idea to review the conceptual article Data Refresh in Power BI.