Monitoring
is essential to businesses to ensure a necessary system is up and
running. Monitoring different aspects of your IT Infrastructure setup
can cause a lot of tantrum if not done properly with the right tools.
It doesn’t matter if you have a small or enterprise-level configuration, you can’t ignore the monitoring devices. Even if you own a personal website, you need uptime monitoring.There are many software from open source to a commercial level, which helps you to monitor your infrastructure and notify for any failure. Considering a large number of options, it might be challenging to find one that hangs well on the string of your price range is not easy.
The good thing is, there is a powerful open-source monitoring solution available for you to use. Thanks for the open-source community to maintain them.
Let’s take a look at the best open source monitoring software for IT Infrastructure monitoring and see what works for you.
Nagios
Nagios, founded in 1999, is one of the industry leaders in providing monitoring solutions from small to enterprise-level infrastructure.Nagios is capable of monitoring almost all types of components like network protocols, operating systems, system metrics, applications, services, web servers, websites, middleware, etc.
Nagios runs on a Core 4 monitoring engine, which provides a high level of performance by consuming fewer server resources.

You can integrate with almost any type of third-party software by using a plugin, and most likely, someone has already written the plugin.
If you are into Middleware, you can leverage Nagios to monitor WebLogic, WebSphere, JBoss, Tomcat, Apache, URL, Nginx, etc.
Features
- Centralized view of entire monitored IT infrastructure
- Its event handlers grant automatic restart of failed applications
- Multi-user access
- Selective access allows clients to view only the infrastructure components about them
- An active community of over 1 million users
- Extendable architecture
Zabbix
Zabbix is a splendid enterprise-level software designed to monitor everything from performance and availability of servers, network equipment to web applications, and databases.Zabbix is used by thousands of companies worldwide, including DELL, Salesforce, ICANN, Orange, etc.
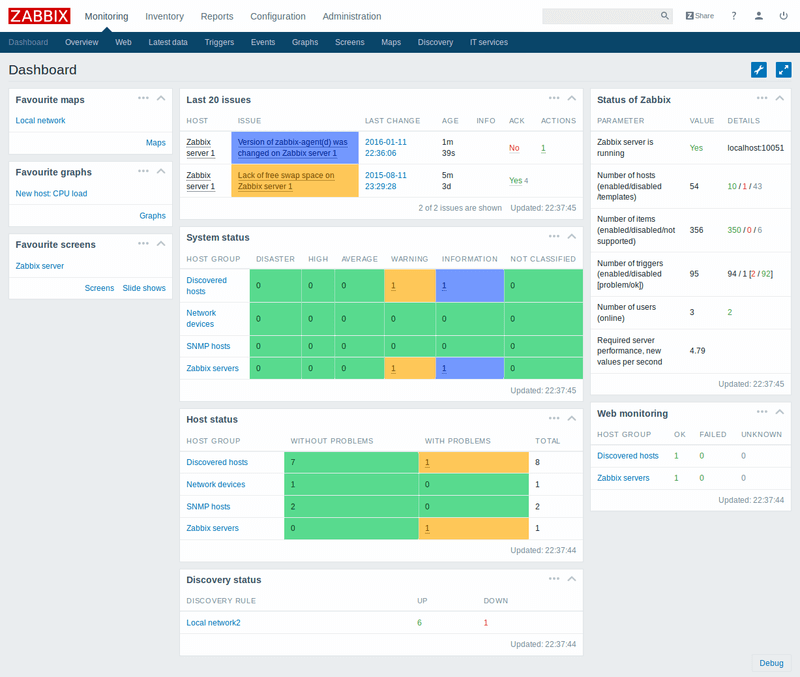
Zabbix is a server-agent system architecture where you got to install the agent on a server (client) to be monitored by the Zabbix server. However, you don’t need to install the agent for services like FTP, SSH, HTTP, DNS, etc.
You can get it installed on Linux, AIX, Windows, Solaris, MacOS X, FreeBSD, OpenBSD, etc.
It supports SNMP and provides better reporting.
Features
- Monitor Java application servers over JMX directly
- VM monitoring allows VMWare, vCenter, and vSpehere
- The front end has self-protection against brute force attacks
- Automation can be done by scripts in various languages like Ruby, Python, Perl, PHP, Java or shell scripts
- Integrates with other system management tools like Puppet, cfengine, Chef, bcfg2 to name a few
Cacti
Cacti is another open-source network monitoring tool that can be installed on Linux or Windows OS. It is connected to RRDTool, which allows us to generate graphs related to relevant network data.It works with SNMP and presents the network statistics in the form of easy to understand charts.

Cacti require MySQL, Apache, or IIS that support PHP.
Features
- Unlimited graph items can be defined for each graph optionally utilizing CDEF or data sources from within Cacti
- Auto padding support for graphs
- Supports RRD(Round-Robin Database) files with more than one data source and can also use an RRD file stored anywhere on the local file system
- User-based management and security
- Custom data gathering scripts
OpenNMS
OpenNMS let you build a network monitoring solution for any IT infrastructure. You can collect system metrics using JMX, WMI, SNMP, NRPE, XML HTTP, JDBC, XML, JSON, etc.With the help of OpenNMS, you can discover layer two network topologies in your network. It’s built on event-driven architecture and supports Grafana.

OpenNMS got built-in reporting, which means you can view the report in a beautiful dashboard and chart. Overall, OpenNMS got an excellent user interface.
You can also install it in Docker.
Features:
- It is specially designed for Linux, but Windows, Solaris, and OSX are also supported.
- Device Temperature monitoring
- Customizable admin dashboard
- Power Supply Monitoring
- IPv4 and IPv6 support
- Events can generate notifications via email, SMS, XMPP, and various other methods.
- Geographical node map to show nodes and service outages using Open Street Map, Google Maps or Mapquest
Icinga
Icinga monitoring framework allows you to monitor all the available systems in your network, which alerts you in the case of an alarm in many ways and provides you with a database for your SLA reporting.Icinga, which began as Nagios Fork in 2009, got freed from the constraints of a fork and crafted Icinga 2, which is faster, easier to configure, more comfortable to scale significantly better.

Features:
- Monitoring of network services, host services, and server components
- It performs monitoring with Icinga 2 plugins.
- Support for event handlers and notifications
- Phone, SMS, call and email support
- Cross-platform support for various operating systems
- Parallelized service checks
- You can choose between 2 user interfaces, Classic UI and Icinga web
- Template-based reports
Netdata
Netdata provides unparalleled real-time health monitoring and performance troubleshooting for systems and applications. Over the past six years of development, Netdata’s GitHub community has been essential to its growth.Netdata is fast and efficient, designed to run on all systems without disruption. Instantly diagnose slowdowns and anomalies in your infrastructure with thousands of metrics, interactive visualizations, and insightful health alarms.

Netdata is free, open-source software, and currently runs on physical systems, virtual machines, containers, and IoT/edge devices.
Features:
- High-resolution metrics, with per-second data collection.
- Auto-detects and monitors thousands of metrics from dozens of services and applications.
- Monitoring for all possible sources, including thousands of metrics per node.
- Meaningful presentation, optimized for visual anomaly detection.
- Advanced alarm notification system for detecting performance and availability issues.
- Quick installation with immediate results—zero dedicated resources required.
- A custom database engine that saves recent metrics to RAM and “spills” historical metrics to disk for long-term storage.
M/Monit
M/Monit tool is used for supervising the process for Unix and Linux. It is a software that has covered the need to manage many identical infrastructure processes.It runs on any POSIX system and uses around 10-15 MB of RAM, depending on how many hosts you monitor. It works with the following database systems:
- MySQL 5.x or later
- PostgreSQL 8.4 or later
- SQLite 3.x

Features
- Easy and a time saver when it comes to installing and setting it up.
- Collects key data from monitored hosts and creates beautiful and easily understandable charts by analyzing the collected data.
- Its user interface is simple, clean, and responsive. Its UI can rearrange itself to fit the device screen.
- Manage and monitor both the background or daemon processes.
- Higher application uptime because it can handles error conditions automatically, without human intervention.
- Monitor processes, servers, disks, files, folders, and cloud activities.
- Control the services remotely.
- HTTP rest API to query M/Monit for data.
- Based on existing data, we can extrapolate future values by using its trend predictions feature.
LibreNMS
LibreNMS is a fully featured network monitoring system. It is based on PHP/MySQL/SNMP. LibreMNS covers a wide range of operating systems and network hardware.
It can do interface-grouping based on the prefix of the interfaces. The entire network can be automatically discovered by the use of SNMP, CDP, ARP, FDP, OSPF, LLDP, and BGP.
Features
- A highly flexible and reliable alerting system is being used here. So, immediate notifications will pop up via email, IRC, Slack, etc.
- Whatever data will come in from the installation, LibreMNS can retrieve, manage, and graph it using the full API it has.
- Another very important feature is its capability to generate the bandwidth bills on the network, based on the usage.
- As the network grows, you can scale it horizontally.
- It provides integration support for NfSen, collected, SmokePing, RANCID, Oxidized.
- It supports multiple authentication methods with MySQL, HTTP, LDAP, Radius, Active Directory.
- Extensive device support with mobile-friendly web UI.
Conclusion
Above listed monitoring software can get you started in FREE to monitor various aspects of IT infrastructure.